
Which Blood Tests Are Most Important?
We’re hearing a lot these days about cholesterol not being the baddy that we once thought it was.
The analogy I like the most is seeing cholesterol molecules around an inflamed damaged artery is like seeing firefighters at a fire scene. They are the good guys trying to help out.
There’s still a lot of confusion about it even in the medical profession. Here are some of my favourites and their thoughts.
Hopefully they will help you resolve your confusion and get some confidence with interpreting your results and indeed what results to look for and pay attention to. There’s nothing like educating yourself and if you need to educate your doctor it’s a good collection of resources to refer him to.
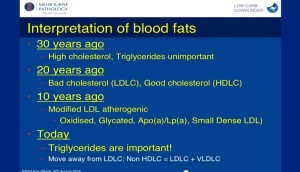
Prof Ken Sikaris – History of medical thought
How Blood Fat Interpretation has changed over the years
The Key Blood Tests
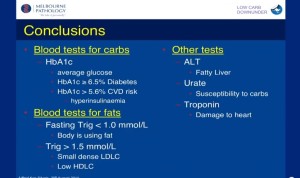
There are two primary tests that Ken says you need to have:
1. Your FASTING Triglyceride levels. Your doc may want to do non-fasting. Ask for fasting as TG’s raise when eating. You want the baseline levels
2. Your HBA1C
Both want to be low.
Axel F. Sigurdsson – Clarity on what numbers to look for
Axel has a great post where you can look at your blood tests and compare them to what his ideals are. He has put them in both of the common measurements used in the world so you won’t need to translate yours.
Over more time it has been clarified that:
1; TG/HDL Ratio is the best predictor of blood vessel disease
2: HBA1C is a good thing to keep down. Even T2 Diabetic’s should be aiming for <5.6 not just <7.
3: CRP is a good measure of inflammation in your body.
4: That a high LDL is a good predictor of reduced all cause mortality. Particularly in the over 65’s the higher your LDL the better life and health span you are likely to have. And I imagine particularly in the presence of optimal measurements for TG/HDL ratio, HBA1C and CRP.
David Diamond and Malcolm Kendrick
Plenty of evidence is now coming to light that factors that increase platelet aggregation/blood clotting are what you really need to look out for to protect yourself from blood vessel disease aka heart attacks and strokes. Neuroscientist David Diamond and Scottish GP Malcolm Kendrick’s are two of my favourite sources of information here.
Key things there are:
- smoking – increases clotting
- low exercise – exercise breaks clots down
- high blood sugar – increases clotting
- high insulin – increases clotting
- high cortisol and adrenalin – stress increases clotting
So not smoking if you smoke, getting into some exercise you enjoy if you don’t, lowering your carbohydrate intake to be within your carbohydrate tolerance level and reducing levels of stress in all the situations you find stressful are key factors to reduce the risk of stroke or heart attacks. Exercise, along the Goldilocks principle of not too much and not too little is one of the best ways to reduce cortisol, and therefore stress, long term.
https://www.youtube.com/watch?v=yX1vBA9bLNk&t=707s&list=PL703A2C1ACB86FD95&index=150
David Diamond
Robert Lustig
This video came out in 2022. Provides another overview of what I’ve been sharing in this page. Educating doctors is an ongoing problem in our increasingly manipulated scientific environment.
To summarise:
- Waist to Height ratio is a simple easy thing for most people to do and keep tabs on. Measure waist first thing in the morning. Tape measure around belly at navel level with a relaxed stomach. You want this close to 1/2. Mortality risk increases when you are too thin or too fat. If you’ve never heard of this before here are two pages for you to check out the charts for men and women. PLOS Article and Bariatric News
- TG/HDL Ratio. TG’s want to be as low as possible and HDL wants to be as high as possible.
- Fasting insulin. Low numbers like 3-4 are great. Average is 8. 10 and over is bad.
- Liver enzymes on the low side
- HBA1C below 5.6
- Thyroid issues can mimic metabolic syndrome. TSH wants to be in the 0.5-1-1.5 range.
- If your tests are all good but LDL is very high you could do a CAC scan. It’s a scan to measure your Coronary Artery Calcium score. I’ve heard there are some concerns over usefulness depending on how it is done so I’ll add a section on that at a later date.
Paul Mason
Great update on tests particularly the Glucose Tolerance & Insulin Response testing that we hope will become more the norm.
My Results
Here are my results, over time, to give you an idea.
I’ll see if I can get my earlier ones.
As you may imagine my GP says that with Familial Hypercholesterolaemia, the cardiologist he works with would prefer me on statins. But he also knows and accepts my opinions on the issue. Those HH in bold bright red are enough to scare you silly if you didn’t know who to trust and pay attention to.
19 June 2015, Lipid Tests
Patient Details
Patient Name: RENNIE, DARAG S
Date of Birth: 27-Feb-1955
Fasting status: Fasting
Cholesterol: 9.9 mmol/L ( < 5.0 ) HH
Triglyceride: 1.5 mmol/L ( < 2.0 )
HDL Cholesterol: 1.44 mmol/L ( > 1.00 )
LDL cholesterol: 7.8 mmol/L ( < 3.4 ) H
Chol/HDL Ratio: 6.9 ( < 4.5 ) H
Comment:
For established CVD risk (including diabetes) NZGG optimal levels are Cholesterol < 4.0, LDL < 2.0 and Chol/HDL ratio < 4.0.
19 Aug 2016, Lipid Tests
Patient Details
Patient Name: RENNIE, DARAG S
Date of Birth: 27-Feb-1955
Fasting status: Fasting
Cholesterol: 10.6 mmol/L ( < 5.0 ) HH
Triglyceride: 1.1 mmol/L ( < 2.0 )
HDL Cholesterol: 1.75 mmol/L ( > 1.00 )
LDL cholesterol: 8.4 mmol/L ( < 3.4 ) HH
Chol/HDL Ratio: 6.1 ( < 4.5 ) H
13 Sep 2017, Lipid Tests
Patient Details
Patient Name: RENNIE, DARAG S
Date of Birth: 27-Feb-1955
Fasting status: Fasting
Cholesterol: 11.2 mmol/L ( < 5.0 ) HH
Triglyceride: 1.6 mmol/L ( < 2.0 )
HDL Cholesterol: 1.74 mmol/L ( > 1.00 )
LDL cholesterol: 8.7 mmol/L ( < 3.4 ) HH
Chol/HDL Ratio: 6.4 ( < 4.5 ) H
Comment: For established CVD risk (including diabetes) NZGG optimal levels are Cholesterol < 4.0, LDL < 2.0 and Chol/HDL ratio < 4.0.
Let’s look at my TG/HDL ratio:
2015: TG 1.5/HDL 1.44= 104166667/1.04
2016: TG 1.1/HDL 1.75 = 0.6285713/0.63
2017: TG 1.6/ HDL 1.74 = 0.91954023/0.92
Looking at both Ken’s and Alex’s thoughts.
Ken would like TG’s at 1 or below. The closest I’ve got to that is 1.1.
Axel says TG/HDL-C ratio less than 0.87 is ideal. Which I did achieve in 2016. With TG/HDL-C ratio above 1.74 being too high and 2.62 being much too high. So for me 0.92 is close enough to 0.87 for me to be happy. Although I’d still be happier with my TG’s being closer to 1. The main tweak I believe I need to make to bring it lower is to be more consistent with carb restriction.
To complete the picture:
Waist to Height ratio: 0.48 – pretty much an ideal number for men
HbA1c all years: 32 mmol/mol ( < 41 ) = 5 in US system
Liver Function: always normal numbers
TSH: always normal
hsCRP: Never tested. In NZ there are two CRP tests. The hsCRP is the one to get.
CAC Score: I may look at doing one of these when I get back to NZ.
You’ll find my free book and video series on healthy eating here: https://www.daragrennie.com/health/evolving-food-pyramids/